Ari Kuncoro: V Pattern Pandemic-Built Recession
Nino Eka Putra ~ PR of FEB UI
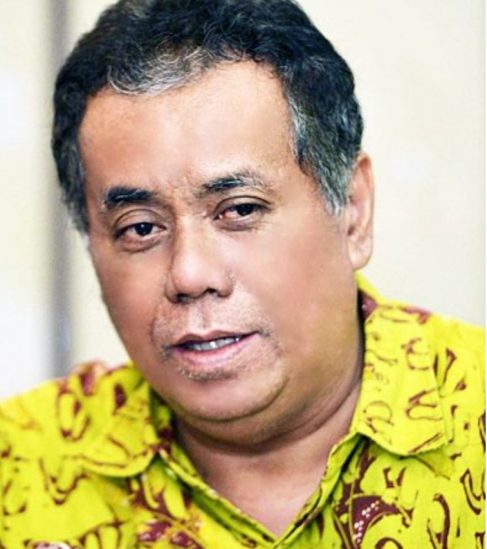
DEPOK – Friday (9/10/2020), Professor Ari Kuncoro, Rector of Universitas Indonesia, released his article, published in Kompas Daily, an Opinion rubric, entitled “V Pattern V Pandemic-Built Recession”. Following is the article:
“V Pattern Pandemic-Built Recession”
The World Bank predicts Indonesia’s economic growth in 2020 will be negative for the first time since 1998, with a range of minus 2 to minus 1.6 percent. The implication is that growth in the third and fourth quarters will be negative, although not as deep as the second quarter.
The recovery pattern may be an asymmetrical modification of the V pattern with a sloping right tail. This reflects that the Covid-19 pandemic has revealed different consumption patterns in society, between the lower middle and upper middle groups.
Recession patterns in several countries
There are two very different types of recovery, namely China which has a pattern of recovery V due to its societal discipline and vaccines, versus the European Union (EU). In addition, China’s position as the world’s manufacturing hub also allows stimulus leverage at a maximum level. After experiencing a negative growth of 6.8 percent in the first quarter of 2020, China managed to rise, growing 3.2 percent in the following quarter.
In the EU, on the other hand, after strict lockdowns were put in place in most EU countries, the pattern of recovery V is not yet visible. Whether the pattern will be similar to a V or something else, really depends on the growth in the third and fourth quarters. If the contraction is as deep or deeper than the second quarter and then reoccurs in the following quarter and thereafter, the pattern will more likely resemble a U or even L.
Spain and France are representatives of the EU economy which depend on the service sector, particularly tourism. The two countries are on a lockdown, which is among the strictest. Both experienced deepening economic contraction since the first quarter of 2020. Spain’s growth worsened from minus 4.2 percent to minus 21.5 percent. France from minus 5.7 to minus 18.9 percent.
Vietnam escaped negative growth. Covid-19 caused Vietnam’s economy to experience a slowdown in growth from 7 percent in quarter IV-2019 to 3.82 and 0.36 percent in quarters I and II-2020. Vietnam applied the concept of universal warfare from its experience of the war against the US. Every citizen becomes an informant of who is showing symptoms of exposure to Covid-19. Vietnam became a giant surveillance machine that collaborates with health system data centers with immediate reporting.
This made the European-like sweep lockdown unnecessary as tracking works at a micro level. Adaptive and selective lockdown in the style of adaptive learning (Evans and Honkapohja-2001) was implemented immediately when news of the outbreak in Wuhan broke out in February, closing schools, communities, borders and a 14-day quarantine for overseas visitors. As a result, logistics mobility was maintained so that economic growth, although slowing down, remains in the positive zone.
Japan in the first quarter was able to minimize contraction with a growth of minus 1.8 percent and was quite optimistic about the partial tightening lockdown imposed on Tokyo and Osaka. Japan was very surprised when its economy contracted to minus 9.8 percent in the second quarter of 2020. In fact, the government has provided a stimulus equivalent to US $ 929 billion plus US $ 1.1 trillion in the second package. One thing that was not taken into account is the aging Japanese population.
People who are old are not very interested in buying durable goods. Meanwhile, the young population is more concerned with access than ownership, both for vehicles (public transportation) and property (renting). The only consolation for the people is taking the difficult journey due to the pandemic. Automotive exports have also stagnated due to the recession in export destination countries. As a result, a liquidity trap phenomenon occurred, the stimulus failed to turn the economy around as it only settled in the form of savings.
In an effort to roll back economic activity, Japan introduced the term travel bubble, where travelers from 10 countries who are deemed able to control Covid-19 are given priority to visit.
How about in Indonesia?
The pattern of economic recovery in Indonesia this time is unlikely to look like the recovery process during the 1998 crisis. At that time the source of the crisis was the depreciation of the rupiah against the US dollar, which had fallen from Rp 2,500 per US dollar to reaching Rp 15,000 per US dollar. To return to positive annual (yoy) growth, six quarters were required.
The negative growth started from the first quarter of 1998 and continued to worsen until it reached its lowest point, minus 18.3 percent in the fourth quarter of 1998, and then improved even though it was still in the negative zone. New positive growth can be achieved in the second quarter of 1999. Even though it took a long time, with a deep contraction in Q4 / 1998, graphically the recovery pattern still looks like a V with a steep tail. However, a full recovery did not happen immediately. When the growth started to be positive, it took two more quarters until the fourth quarter of 1999 to achieve above 5 percent growth.
The economic crisis facing the world this time is the default pandemic that has severed the demand and production side of the economy. Based on predictions from the government and the World Bank, it seems that for Indonesia the pattern V will not be too deep. The pandemic resulted in growth slowing down to 2.87 percent in the first quarter of 2020.
Contraction occurred in the second quarter with a growth of minus 5.32 percent, much shallower than what happened in 1998. The lower limit of the growth forecast for the third quarter is between minus 2 percent (World Bank) and 2.9 percent (government). This indicates that the V pattern will lean to the right with an elongated tail which indicates that even if the contraction is not as deep as other countries, the recovery will be gradual, possibly entering 2021.
Policy implications
The pattern and time needed to regain positive growth depends on domestic demand, particularly consumption. Learning from the 1998 economic crisis, consumption led to economic recovery, followed by investment as a source of economic growth. The proverb is “saving is the basis of wealth “, but the paradox of a thrift concept of excessive saving actually leads the economy into a deeper recession.
Society is not really to blame, because this time the cause was a pandemic. Therefore, it is important for the government in economic recovery to manage public expectations.
The publication of the BI Consumer Confidence Index (IKK) shows that there has been a decline in the tendency to shop (marginal propensity to consume / MPC) from 0.69 in March to 0.674 in August. This means that people spend only 67.4 percent of their income on consumption. Meanwhile, the percentage of savings increased from 18.6 to 20.4 percent. The remaining income is used for installments, the portion that is relatively stable at 12.2 percent. This installment has the potential to be used as a target for relaxation policies to generate expenditure switching.
The figures above occur for all income groups between IDR 1 million and IDR 5 million, but not for those above IDR 5 million per month. The threat of layoffs (PHK) actually made them increase their savings. The pandemic causes mobility and physical interaction to reduce the income of the production sector, which has layoffs potential. The Research and Development Survey of the Ministry of Manpower, LIPI and the UI Demographic Institute found that 13.9 percent of employers reduced / laid off employees. Meanwhile, almost half or 49.6 percent dismiss some employees without layoffs.
Only the income group above Rp 5 million had their share of savings decreased from 19 to 18 percent, which indicates that there was purchasing power being spent. However, the purchasing index for durable goods in this category decreased slightly from 77.5 to 75.2 after rising sharply from 60 in July. The explanation is that this group is still able to travel or eat out for relaxation and leisure, but they are still not too interested in buying durable goods.
Another symptom showing was that the group that purchases durable goods, such as household appliances, is the income group of Rp 1 million to Rp 2 million. At first glance it looks like an anomaly. The explanation is that the declining MPC shows that even though some are still saved, social assistance in this group has an impact on the shift from leisure spending to durable goods (expenditure switching).
The increase in the manufacturing sector Purchasing Manager Index (PMI) from 46.6 in July to 50.8 in August was a consequence of this behavior. However, this behavior is not yet stable. For the record, the PMI index fell again to 47.2 in September in line with the re-tightening policy in DKI Jakarta as a result of the increase in positive cases of Covid-19. Installment relaxation has the potential to make this behavior more stable.
Learning from the experience of the 1998 crisis where the agricultural sector continued to grow positively; trade, hotel, restaurant and manufacturing followed by leading the economy’s recovery out of recession. In order to obtain a letter V recovery, two groups of people,with different policies need attention.
For the lower middle class, the policy for absorption of the National Economic Recovery (PEN) budget, which is oriented towards social assistance and relaxation must continue to be improved, especially since their behavior has the potential to boost momentum in the manufacturing sector. For the upper middle class, expectations about public health conditions must continue to be improved with better coordination in handling Covid-19. This group expenditure will stimulate recovery in the trade, hotel, restaurant sector and, in turn, the transportation sector. (hjtp)
Source: Kompas Daily. Edition: Friday, 9 October 2020. Opinion Rubric. Page 6.
(am)

